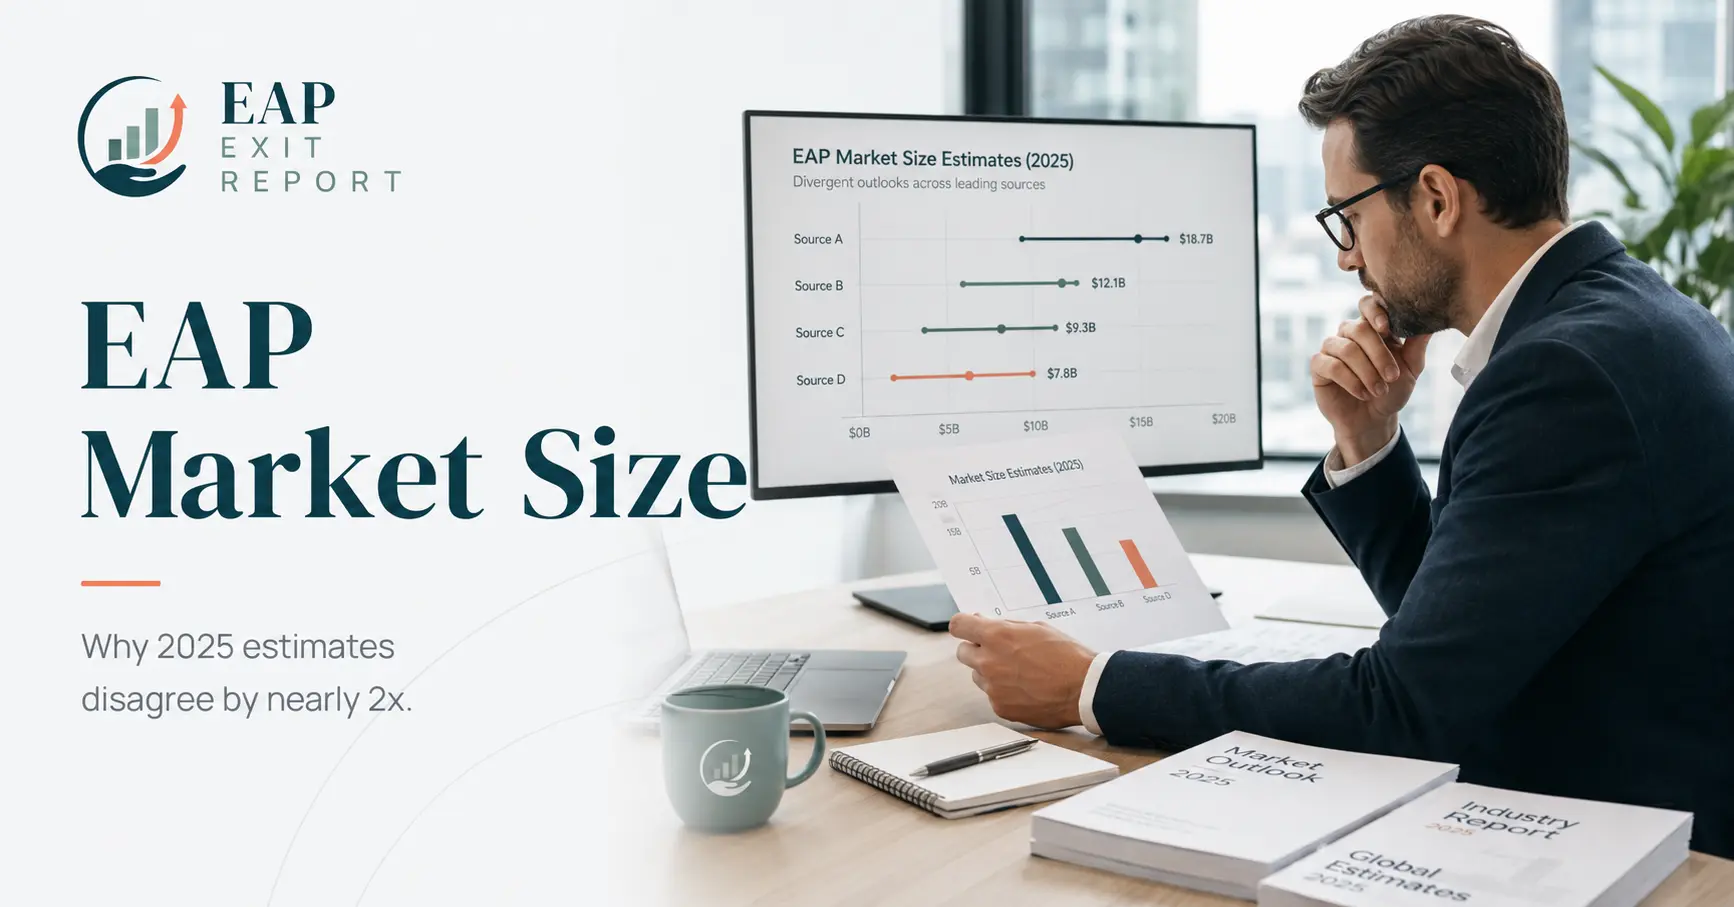
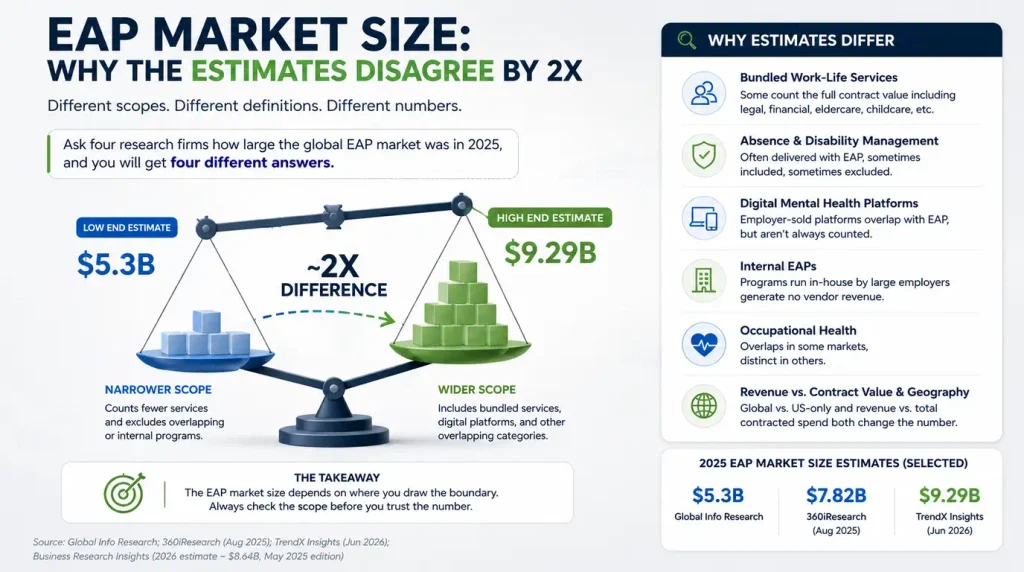
Ask four research firms how large the global employee assistance program (EAP) market was in 2025 and you will get four different answers, the largest of which is nearly double the smallest.
That is not a rounding problem, and it is not one firm being careless. The EAP market size question has no settled answer because the sector has no settled boundary, and the firms publishing estimates draw that boundary in materially different places. Understanding where they draw it is more useful to an owner than any single figure, because the number a buyer has in their head shapes how they think about your growth runway.
Here are the estimates, why they diverge, what the growth forecasts are really measuring, and what to do with an EAP market size figure once you have one. None of it takes long, and it will save you from repeating a number in a room where somebody has already checked it.
What the published estimates actually say
For 2025, across the sources we could verify:
| Publisher | 2025 estimate | Published |
|---|---|---|
| Global Info Research | approx. USD 5.3bn | — |
| 360iResearch | USD 7.82bn | August 2025 |
| TrendX Insights | USD 9.29bn | June 2026 |
Business Research Insights has separately put 2026 at approximately USD 8.64bn (Business Research Insights, May 2025 edition).
So the range for the same market in the same year runs from roughly USD 5.3bn to USD 9.29bn — a spread of about 75%.
We publish this as a range rather than selecting one figure, and we would encourage you to be skeptical of any adviser who quotes a single confident EAP market size without naming the source and the scope behind it. The single number is the least informative part of the picture.
Why they disagree
The divergence is caused by scope. Every research firm has to decide what counts as an EAP, and reasonable people decide differently on at least six questions.
Does bundled work-life count? Most EAP contracts include legal consultation, financial counseling, eldercare and childcare referral, and identity theft support. Some sizings count the full contract value; others attempt to isolate the clinical counseling component.
Does absence and disability management count? Several large providers deliver EAP alongside absence management and return-to-work services under a single employer relationship. Splitting that revenue cleanly is difficult, and some publishers do not try.
Do digital-first mental health platforms count? This is the biggest single swing factor. Employer-sold digital mental health platforms overlap with EAP in buyer, budget and function, but they are not always structured as EAPs. Include them and the market expands substantially.
Do internal EAPs count? Some large employers run their own internal programs with employed counselors rather than contracting an external provider. That activity has economic value but generates no vendor revenue. Most sizings exclude it; not all say so.
Does occupational health count? Overlapping in some markets, distinct in others.
Is it revenue or contract value, and in which geography? Global versus US-only makes an obvious difference, and so does whether the figure represents provider revenue or total contracted spend.
Widen the boundary on three or four of those and the EAP market size roughly doubles. Nothing dishonest has occurred. The publishers are answering slightly different questions.
How to read a market report without being misled
Four checks, and they take about ten minutes.
Find the scope definition. It is usually in the methodology section, sometimes only in the full paid report. If a summary page gives you a number and a growth rate but no definition of what is being measured, treat the number as unusable.
Check the base year and the publication date. A 2026-published report may still be building from 2023 or 2024 primary data with modeled forward estimates. Reports also get reissued with updated covers and largely unchanged underlying research.
Distinguish estimates from projections. A 2025 figure derived from company reporting is a different kind of claim from a 2032 figure derived from a compound growth assumption. The further out the projection, the more it reflects the assumed growth rate rather than any observation.
Ask who the report is for. Syndicated market reports are commercial products sold largely to vendors and investors, and a larger, faster-growing market is a more saleable report. That is not an accusation of bad faith. It is a structural incentive worth holding in mind.
Applied honestly, those four checks will lead you to the same conclusion we reached about the EAP market size question: the responsible thing to publish is the range and the reason for it.
Why every EAP market size figure needs a date attached
One more habit worth adopting, because it costs nothing and prevents a specific embarrassment.
Syndicated research gets reissued. A report published in June 2026 may carry a 2025 base year built on 2023 primary data, and the same publisher may have a newer edition with a materially different number. Owners who cite an EAP market size figure in a management presentation and are then shown a more recent estimate from the same publisher lose credibility over something entirely avoidable.
The rule: publisher, figure, year measured, and date published. All four, every time. If you cannot establish all four, do not use the number.
This applies with particular force in a diligence context. Anything in your materials will be checked, and a stale or unattributed market figure invites the buyer’s team to check everything else more carefully. That is an expensive way to save ten minutes.
Why the number a buyer uses affects your deal
This is the part that matters to an owner, and it is the reason we bothered writing all of the above.
A buyer’s view of the EAP market size determines their view of two things: how much room you have to grow, and who they think your competitors are.
A strategic EAP consolidator sizing a roughly USD 6bn outsourced-EAP category is underwriting a mature market where growth comes largely from taking share and from consolidation. Your growth story needs to be about renewals, share gain and geographic expansion.
A digital mental health acquirer sizing a much larger “workplace wellbeing” category, with digital platforms and adjacent services included, is underwriting a market they believe is expanding. Their model may support a more optimistic forward view, and they may value your employer relationships as distribution into a bigger opportunity than the one you think you are in.
Neither framing is wrong. But they produce different conversations, and an owner who understands which framing a buyer is using can present the business accordingly. If a buyer’s questions keep circling back to digital engagement and product attach rates, they are sizing a different market than the one you have been operating in. Who buys EAP companies sets out how the four buyer classes differ.
There is also a defensive use. A buyer who argues that the market is small, mature and shrinking is making an argument about your growth prospects, and therefore about your value. Knowing that published estimates span a 75% range means you can ask which sizing they are working from and why. That question alone changes the tenor of a conversation.
What the growth forecasts are actually measuring
Every EAP market size report comes with a growth rate attached, and growth rates deserve more suspicion than the base figures do.
A projected compound annual growth rate is an assumption dressed as a finding. It is built from some combination of historical observation, analyst judgment and modeled drivers, and the further the projection runs, the more of it is assumption. A 2032 figure is almost entirely the growth rate rather than any observation of the market.
Three specific things to check before repeating one.
Is the growth definitional or real? A category that grows because digital mental health vendors were added to it this year has not grown. The measurement changed. This is the single most common reason EAP market size forecasts look more exciting than the experience of operating in the sector feels.
Is it price growth or volume growth? More employers buying EAP, more covered lives, or the same book at higher per-employee-per-month rates are three different stories with three different implications for a provider. Aggregate revenue growth conceals all three.
Does it match what you see at renewal? You have primary data that no research firm has: what happened to your own pricing and retention over five years. If a report projects strong growth and your renewals are flat on price, one of you is wrong, and it is worth working out which.
How to size your own addressable market
Far more useful than any global figure, and it takes an afternoon.
Start with employers, not dollars. Count the organizations in your geography and sector focus above your minimum viable size — say 200 employees. State business registries, chambers of commerce, industry associations and commercial databases will get you a workable count.
Apply a conservative penetration assumption. Some proportion already have an EAP, internal or contracted. Note explicitly that you are estimating.
Multiply by employee count and your own average PEPM rate. Not a published rate. Yours, from your own contract file, because that is the price you can actually achieve.
Subtract what you realistically cannot win. Employers locked into multi-year agreements with global providers, those requiring multi-country coverage you do not have, those inside payer relationships you cannot displace.
What remains is a bottom-up addressable market built on your own economics rather than someone else’s category boundary. It will be far smaller than any published EAP market size figure, and far more credible in a management presentation — buyers have heard top-down sizing from every seller they have ever met, and they discount it accordingly.
What EAP market share data actually exists
Very little, and it is worth being direct about this, because EAP market size and market share are routinely conflated.
Provider-level market share in the EAP sector is largely unpublished. Most operators are private and do not disclose revenue. Several of the largest sit inside larger telecom, insurance or benefits groups where EAP revenue is not separately reported. A few disclose covered-lives figures, but covered lives and revenue are only loosely related given how widely per-employee-per-month pricing varies — reported PEPM commonly falls around USD 1–5 depending on scope (GlobalGrowthInsights, February 2026).
What this means practically: any ranked list of the largest EAP companies you encounter is built on estimates, not disclosures. Some are careful estimates. Some are search-engine bait. The distinction is rarely signposted.
We are not publishing a ranked list until we can source each row from a disclosure with a date attached. That restraint costs traffic. It is the only version of the exercise worth citing.
There is a second reason for the caution, and it is not editorial squeamishness. A ranked list of the largest EAP companies, published with authority and wrong in a way that understates a private operator, is a commercial claim about a named business. In a sector where the operators are private and litigious about competitive positioning, an unsourced ranking is a liability as well as a credibility problem. Sourced or absent — there is no useful middle ground, and the EAP market size question is best served by publishing the range and the reasoning rather than a league table nobody can verify.
What we are doing about it
The honest summary of this whole page is that the EAP market size question is currently answered badly by everyone, including us.
So the EAP M&A Market Update is being built as a primary-source exercise rather than a synthesis of other people’s syntheses. Disclosed transactions with dates and sources. Covered-lives and revenue figures where operators have actually disclosed them. A stated scope definition published alongside the numbers, so a reader can see exactly what is in and out. And an explicit note wherever a figure is an estimate rather than a disclosure.
It will produce a smaller, more conservative picture of the market than the syndicated reports do. That is the point. A number you can check is worth more than a number that is merely large, and in a sector where owners are making once-in-a-lifetime decisions, being able to check matters.
The practical summary is short. Treat every EAP market size figure as a claim with a boundary attached, ask what the boundary is, cite the range rather than a point, and build your own bottom-up number for anything that actually matters. The wider structure of the market — the tiers, the ownership models, and why consolidation is happening at all — is in the market consolidation pillar, and the ownership picture specifically is in EAP ownership models. How the pricing model underneath all of this works is in the EAP revenue model piece.
Owners who want a view of where their own business sits relative to the market as buyers are actually describing it right now will find that specialist sell-side firms including Olympic M&A have that conversation well before any process begins.
Frequently asked questions
How big is the EAP market?
Published estimates for the global employee assistance program market in 2025 range from approximately USD 5.3bn (Global Info Research) to USD 7.82bn (360iResearch, August 2025) to USD 9.29bn (TrendX Insights, June 2026). The spread reflects differing scope definitions rather than measurement error.
Why do EAP market size estimates vary so much?
Because publishers draw the sector boundary differently. Key variables include whether bundled work-life services, absence and disability management, digital mental health platforms, internal employer-run programs and occupational health are counted, and whether the figure represents provider revenue or total contracted spend.
Which EAP market size estimate should I use?
None on its own. Cite the range with the publishers and dates attached, and state the scope you mean. A single figure quoted without its scope definition is not a usable claim, particularly in a valuation or investment context where the assumption behind it matters.
Is there reliable EAP market share data?
Not currently at provider level. Most EAP operators are private and do not disclose revenue, and several large providers sit within larger corporate groups where EAP revenue is not separately reported. Ranked lists of the largest EAP companies are built on estimates rather than disclosures.
How does market size affect what my EAP business is worth?
Indirectly, through the buyer’s growth assumptions. A buyer sizing a mature outsourced-EAP category underwrites growth from share gain and consolidation. A buyer sizing a broader workplace wellbeing category may underwrite faster expansion and value employer relationships as distribution into a larger opportunity.
Is the EAP market growing?
Published sources generally show growth, though rates vary with the same scope differences that drive the size estimates. Growth attributed to digital mental health adoption may reflect an expanded category boundary rather than growth in traditional outsourced EAP services specifically.