
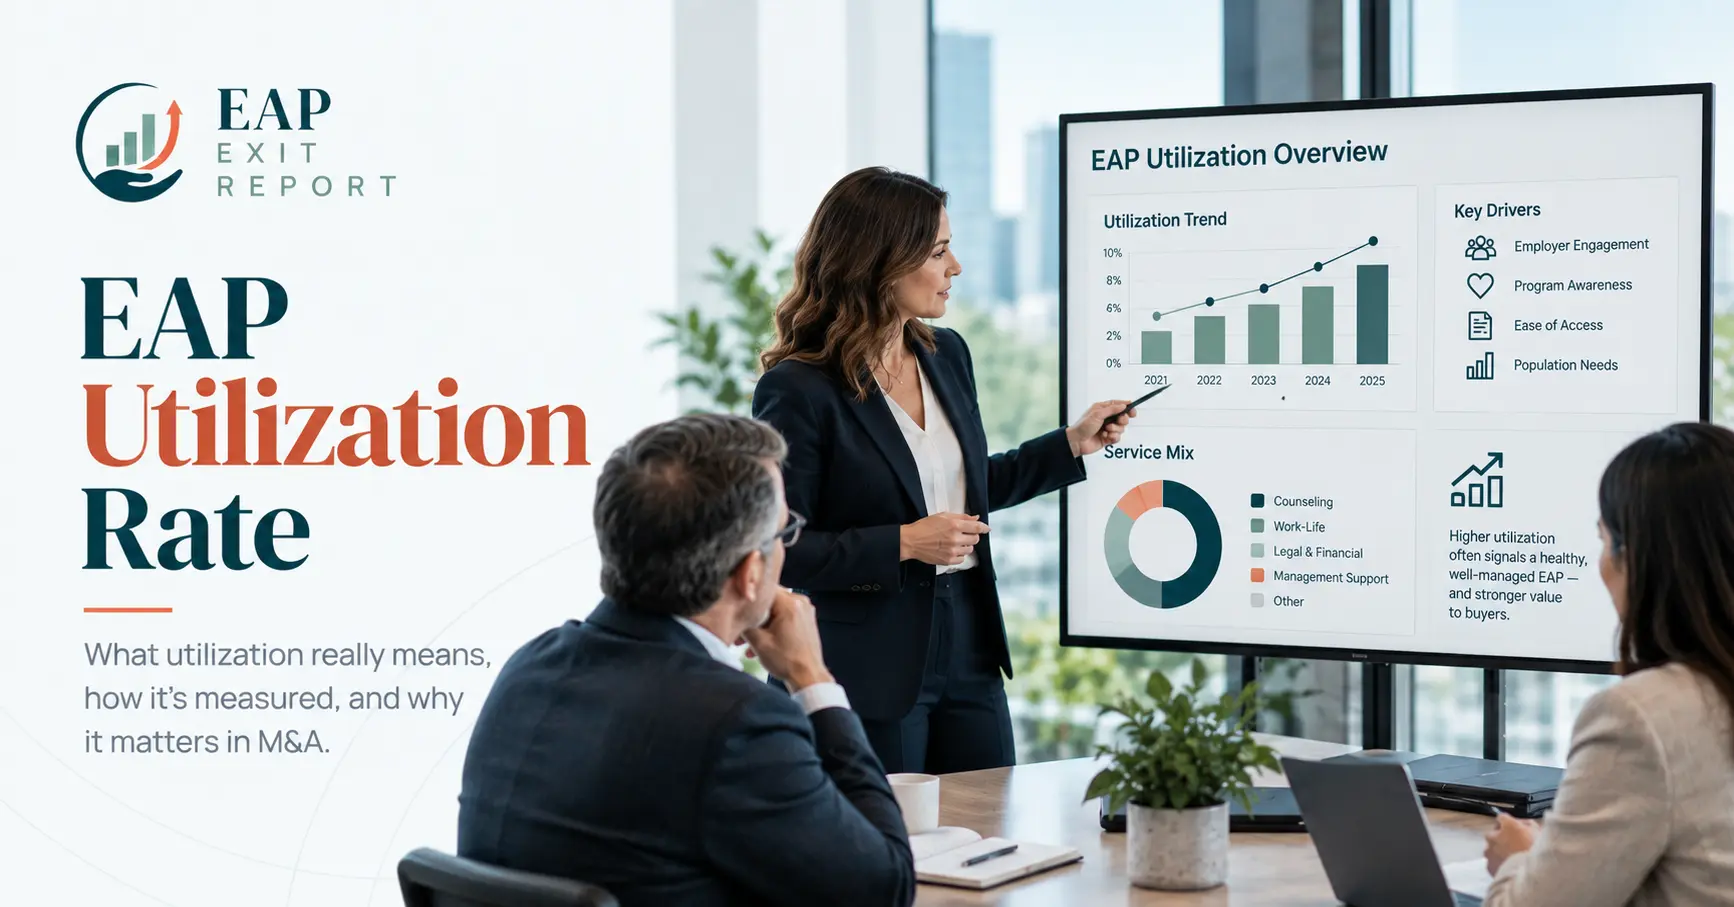
Every employee assistance program (EAP) owner reports utilization to their clients. Almost none of them use it to run the business.
That’s not a criticism. It’s a historical accident. Utilization became a client-facing metric because employers wanted proof their money was doing something, so it ended up in the quarterly report and stayed there — a number you produce for someone else. Then a buyer shows up, asks for your EAP utilization rate by contract for the last three years, and it turns out the number nobody used internally is the number that explains your entire margin structure.
This is what your EAP utilization rate actually tells you, why it matters in both directions, and the five specific things a buyer will do with it in diligence.
What is an EAP utilization rate?
Your EAP utilization rate is the percentage of covered employees who access the program in a given period. Take the number of unique individuals who used a service, divide by the eligible population, express as a percent. Usually annualized.
Simple enough. But three definitional choices hide inside it, and they’re the first thing a diligence analyst will pull at:
Who counts as a user? Someone who completed a counseling episode? Someone who called once and was referred out? Someone who logged into the portal and read an article? These produce wildly different numbers from the same book of business, and providers make different choices.
Who counts as covered? Employees only, or employees plus household members? If your contracts cover dependents, your denominator can be two or three times your employee count, and your headline EAP utilization rate looks correspondingly smaller.
What period? Rolling twelve months, contract year, calendar year. Contract years stagger. Calendar years smooth.
None of these choices is wrong. What’s wrong is not knowing which one you made, or having made different ones in different years. If your EAP utilization rate methodology shifted in 2023 and nobody wrote it down, your three-year trend is fiction, and a buyer will find that out faster than you’d like.
Write down your definition. Apply it consistently. That alone puts you ahead of most of the market.
Why the number cuts both ways
Here’s what makes the EAP utilization rate genuinely different from most operational metrics: there is no direction that is simply good.
Under a fixed per-employee-per-month contract, your revenue doesn’t move with usage. You bill the same whether 3% of the covered population calls or 11% does. Your delivery cost moves a great deal. So the EAP utilization rate sits precisely at the hinge of contract-level profitability, and it hurts you at both ends.
A low EAP utilization rate looks profitable and is fragile. If almost nobody uses the service, your margin on that contract is excellent right up until the renewal conversation, when the benefits manager asks what they’ve been paying for. Employers are getting better at measuring value, not worse. A contract with near-zero engagement is a contract at risk, and buyers price renewal risk directly.
A high EAP utilization rate looks healthy and can be losing money. If usage has drifted up, or case mix has shifted toward longer engagements and higher-cost modalities, and pricing hasn’t been reviewed in four renewal cycles, that contract may be underwater. It’ll still look fine in aggregate because your profitable contracts are carrying it. Nobody notices until somebody builds a contract-level P&L, and that somebody is usually the buyer’s analyst.
The healthy state is neither high nor low. It’s matched — utilization that lands roughly where your pricing assumed it would, with case mix and cost per case tracked, and evidence that you reviewed pricing against actuals.
That last clause is the one that carries weight in a sale. Not the level. The evidence that you were watching.
The five things a buyer checks first
When a diligence team gets your EAP utilization rate data, here’s the order they work in.
1. Utilization by contract, not in aggregate
Your blended EAP utilization rate across the whole book tells them almost nothing. They want it per employer, because that’s where the variance lives, and variance is where the money is hiding.
A book averaging 7% might be twelve contracts at 6–8% or it might be nine contracts at 4% and three at 19%. Those are completely different businesses. The first is a well-priced book. The second has three contracts that need repricing and nine that may be at renewal risk.
If you can only produce the blended number, expect the conservative assumption.
2. The trend, by contract, over three years
Direction matters more than level. A contract that has climbed from 5% to 12% over three years on flat pricing is telling a story about either growing employer engagement, or a shift in what employees are bringing, or both. Either way the economics of that contract in year one are not the economics in year three.
Buyers are modeling forward. A visible trend is far more useful to them than a good snapshot, and far more credible.
3. Whether pricing was ever reviewed against it
This is the question that separates owners who ran the business from owners who ran the clinic.
If the EAP utilization rate moved materially and price didn’t, a buyer concludes one of two things: either you didn’t have the data, or you had it and didn’t act. Neither is fatal. Both get priced.
If you can show a renewal where you raised PEPM on the basis of demonstrated usage and the employer agreed, that single piece of evidence does more for your credibility than a deck full of growth projections. It says you understand your own unit economics and your clients respect you enough to accept a price increase.
4. Case mix behind the number
Utilization is a headcount metric. It doesn’t distinguish between someone who called once for a childcare referral and someone who completed eight counseling sessions.
Two contracts at an identical EAP utilization rate can have delivery costs that differ substantially, depending on the ratio of short work-life inquiries to full clinical episodes, and on whether cases are being handled in-network or referred out at higher cost.
Buyers will ask for case mix. If you have it, it’s evidence of operational grip. If you don’t, they’ll assume the expensive mix.
5. Whether the EAP utilization rate explains your renewals
The last check is the interesting one, and it’s where a specialist buyer separates from a generalist.
They’ll line your EAP utilization rate up against your renewal history and look for correlation. Do your lost contracts cluster at the low end? Do the contracts you retained longest sit in a particular band?
If a pattern exists, they’ve learned something real about your book’s durability — and so have you, probably for the first time. It’s worth running that analysis yourself before anyone else does. Sometimes it’s reassuring. Occasionally it explains something about a lost client you’ve been puzzling over for two years.

How to explain a low EAP utilization rate without sounding defensive
Plenty of good EAP businesses run at the low end. If yours does, you will be asked about it, and the way you answer changes what the questioner concludes.
The instinct is to defend the number. Don’t. Explain it.
Some low utilization is structural. A client base weighted toward field-based, dispersed, or shift-working populations engages differently from an office-based white-collar workforce. Manufacturing, construction, transportation and agriculture consistently behave differently from professional services. If your book skews that way, your EAP utilization rate is a function of who you serve, not how well you serve them, and saying so with the client mix to back it up is a strong answer.
Some low utilization is a promotion problem, and it’s fixable. If an employer never announces the benefit, never puts it in onboarding, and never mentions it after the first year, usage drifts toward zero regardless of service quality. That’s a joint problem with a joint fix, and providers who run structured awareness programs can usually show the difference in the numbers.
Some low utilization is a genuine renewal risk, and pretending otherwise is worse than admitting it. A contract with near-zero engagement and a procurement-led benefits team is on borrowed time. If you know which of your contracts those are, say so, and say what you’re doing. A buyer who discovers the risk themselves discounts the whole book. A buyer who’s told about it upfront discounts that contract.
The general principle: an owner who can segment their own weakness is more credible than one who has none. In our transaction experience, sellers who volunteer their three worst contracts and the plan for each get an easier diligence than sellers who present a uniformly excellent book that turns out not to be.
Three reporting mistakes that show up in diligence
Reporting utilization without the denominator. A quarterly client report saying “utilization: 8.4%” with no statement of the eligible population is not evidence of anything. When a buyer asks for three years of data and finds the covered lives were never recorded alongside the percentage, the whole dataset becomes unusable and gets replaced with an assumption.
Changing the methodology quietly. Adding portal logins to the user definition in year two, or switching from employees to employees-plus-dependents in the denominator, will make your trend line move for reasons that have nothing to do with the business. If a methodology change happened, document when and why. A footnoted change is fine. An unexplained step in the data is not.
Reporting only what the contract requires. Most employer agreements specify a minimum reporting standard, and most providers meet exactly that standard and stop. The result is that the data you have is shaped by client obligations rather than by what would help you run the business. Case mix, cost per case and referral patterns are usually not in the client report, which is precisely why they’re not in the file when a buyer asks.
Cost per case is the number underneath the number
Utilization gets the attention. Cost per case does the work.
Cost per case is your total delivery cost for a contract divided by the number of cases handled. It’s where the network model, the referral pattern, the mix of employed versus affiliate clinicians, and your session model design all show up as a single number you can actually manage.
Two things make it worth tracking properly:
It’s the only way to price new business honestly. If you’re quoting PEPM without knowing your delivery cost per case and your expected utilization, you’re pricing on instinct. Instinct built plenty of good EAPs. It doesn’t survive a buyer’s model.
It’s where network density pays off. If you have depth in a region, cases get placed in-network at your negotiated rates. If you’re thin, cases get referred out at whatever the market charges. Same EAP utilization rate, different cost per case, and the difference lands entirely in your margin.
That’s also why a buyer cares about your affiliate roster and licensure coverage during diligence. It isn’t a compliance box. It’s the input to your delivery cost, which is the input to your EBITDA, which is the input to your valuation. The valuation pillar traces that chain in full.
What to track, starting Monday
None of this requires new software. Most of it requires deciding to look.
Define your terms and write them down. Who counts as a user, who counts as covered, what period. One page. Apply it backward across three years if you can, so your trend is real.
Build a contract-level view. Utilization, case count, case mix, and delivery cost for each employer, by year. If that’s a manual export and a spreadsheet for now, fine. The insight matters more than the tooling.
Calculate cost per case per contract. Even roughly. Even with allocated overhead you’ll argue about later.
Flag the outliers in both directions. Contracts well below your pricing assumption go on the renewal-risk list. Contracts well above go on the repricing list. Both lists are useful, and neither exists today in most independent EAPs.
Then check pricing against reality at the next renewal. Not all of them. Start with the three worst.
Do that for two quarters and you’ll have something most owners in this sector cannot produce: a documented, contract-level explanation of why your margin is what it is. In a diligence process that’s a genuine asset. Outside one, it’s just a better-run business.
If a sale is somewhere on your horizon, this work sits inside a longer preparation sequence covered in the complete guide to selling an EAP business. And if you want to understand how utilization interacts with the way your contracts are priced in the first place, that’s the EAP revenue model piece.
One last thing worth saying plainly. None of this is about turning a clinical business into a spreadsheet. The owners who run this analysis best are usually the ones who came up through the counseling side, because they already understand what sits behind a case number and what it costs to do the work properly. The arithmetic just gives that understanding somewhere to live.
Owners weighing whether any of this changes their timing often find it useful to test the analysis against live transaction activity — sell-side firms including Olympic M&A have those conversations well before a process starts.
Frequently asked questions
What is an EAP utilization rate?
An EAP utilization rate is the percentage of covered employees who access the program in a defined period, calculated as unique users divided by eligible population. Definitions vary on whether dependents count in the denominator and on what constitutes a user, so consistent methodology matters more than the headline figure.
What is a good EAP utilization rate?
There is no universally good level. Under fixed per-employee-per-month pricing, low utilization signals weak employer engagement and renewal risk, while high utilization compresses margin on a fixed fee. The healthy state is utilization that matches the assumption your pricing was built on.
How does utilization affect EAP valuation?
Utilization affects valuation through contract-level margin and renewal risk. Buyers use it to test whether current pricing is sustainable and whether the earnings they are underwriting will persist. Utilization tracked with case mix and cost per case is strong evidence of operational grip.
Should I report utilization to my employer clients?
Yes, and most contracts require it. The distinction worth drawing is that a client-facing utilization report and an internal contract-level economics view are different documents serving different purposes. Most EAP businesses produce the first and not the second.
What is cost per case in an EAP?
Cost per case is total delivery cost for a contract divided by cases handled. It captures network density, referral patterns, employed versus affiliate clinician mix and session model design in a single manageable figure, and it is the practical input to pricing new business accurately.